

Financial KPIs for small businesses only help when they’re consistent, comparable, and tied to decisions you can actually make. Most Canadian owners and managers do not have a “numbers” problem. What we usually see is a time problem, a focus problem, and, in plenty of cases, a month-end process that is just a little too loose to support good decision-making.
In 2026, the businesses that feel steady are rarely the ones with the fanciest dashboards. They’re the ones with a reliable monthly rhythm. They close the books, pull the same handful of numbers, and talk through what changed while there’s still time to correct the course.
This guide breaks down five monthly KPIs that give a clear view of profitability, cash, collections, and labour. We’ll cover where each number lives in your reports, what commonly throws it off, and how to use it in a monthly review that stays practical. If you’re setting up financial KPIs for small business tracking for the first time, this approach is straightforward and realistic.
Why these 5 KPIs beat “more reports”
Accounting software can generate endless reports, but more reports do not automatically create more clarity. The point of financial KPIs for small businesses is to spot meaningful changes early, understand what’s driving them, and make decisions while the month ahead is still in your control.
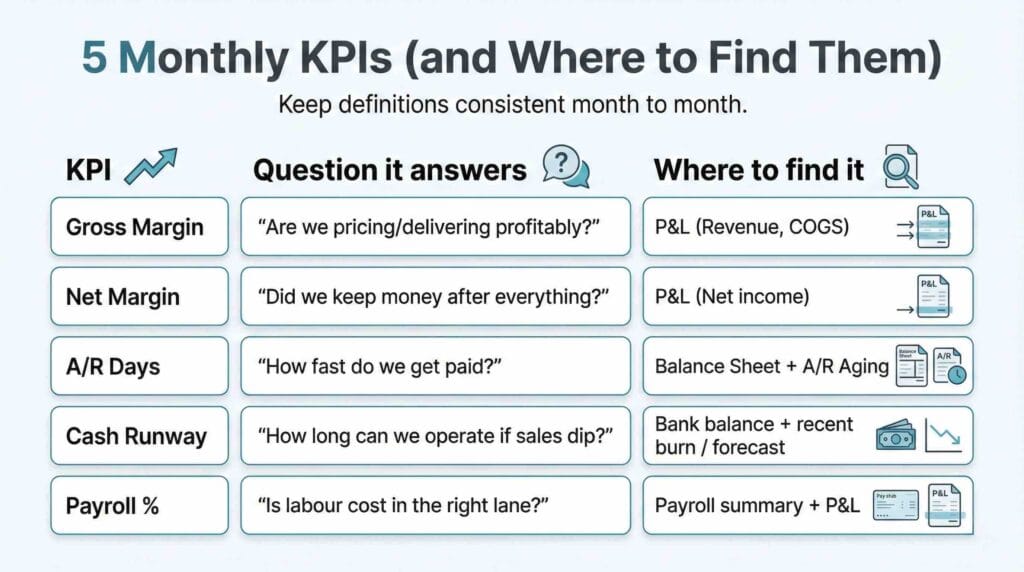
These five KPIs are a strong foundation because they cover the full picture without forcing you into analysis paralysis. Two tell you whether you’re earning enough on the work you sell. One tells you how quickly cash is coming in. One tells you how resilient you are if sales soften. And one keeps labour costs in the right lane as you grow.
Monthly is also a sensible cadence for most Canadian SMBs and mid-market teams. Weekly numbers can be noisy unless you have high volume and very tight processes. Quarterly numbers arrive too late. Monthly is often the sweet spot, frequent enough to steer, not so frequent that it becomes busywork.
There’s also an underrated benefit: these KPIs naturally push you toward a cleaner close. If your month-end close drifts, your financial KPIs for small business drift too, and the leadership conversation turns into “do we trust these numbers” instead of “what are we going to do about them.”
If your close has been slipping, it helps to standardize the routine and the timelines. A practical reference is this month-end close checklist for Canadian businesses.
How to build financial KPIs for small business into a monthly rhythm
Before we jump into the five KPIs, it’s worth making one thing explicit: KPI tracking only works when definitions stay consistent. If payroll costs include benefits one month but not the next, or if subcontractors bounce between COGS and operating expenses, the “trend” you see is often just bookkeeping inconsistency.
A simple rhythm that works for many teams looks like this:
You close the month and reconcile the key accounts.
You pull the same five KPIs using the same definitions.
You review results against last month and the same month last year.
You decide a short list of actions and assign ownership.
That’s the backbone. Now let’s talk about the KPIs themselves.
KPI #1: Gross Margin (Are we pricing and delivering profitably?)
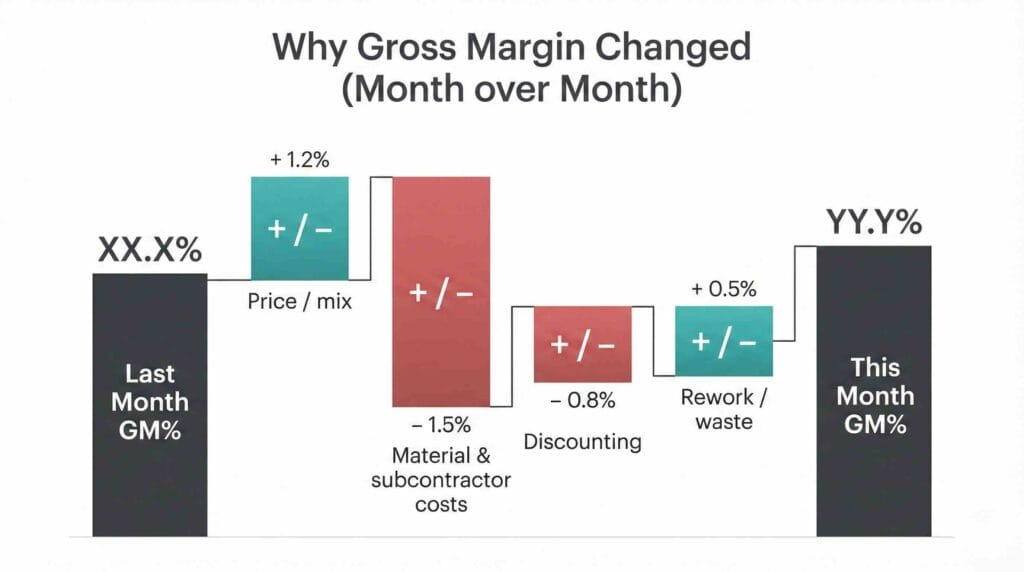
Gross margin is one of the most useful financial KPIs for small business because it connects directly to day-to-day operations. It tells you whether the work you sell is profitable before overhead. When gross margin slips, the “why” is usually operational: input costs rose, pricing lagged, discounting increased, rework crept in, or direct labour is being captured differently than it was last month.
Formula: (Revenue − Cost of Goods Sold) ÷ Revenue
Where to find it:
On your Income Statement (P&L). Most systems show Revenue, COGS, and Gross Profit, and many will calculate the percentage automatically.
What we sanity-check before trusting the trend:
COGS mapping. If costs move between COGS and operating expenses from month to month, gross margin will appear to change even when the underlying business didn’t. Trades, construction, and project-based businesses often see this first with subcontractors, materials, and job costs.
Directional targets (use as context, not as a rule):
BDC notes that 50 to 70 percent gross margin can be healthy for many businesses, and that service firms may consider 50 percent low depending on the model. Their glossary explanation is clear and worth bookmarking: gross profit margin ratio. Retail is typically much lower, and even broad Canadian retail data tends to sit far below typical service margins, depending on the subsector. If you want a Canadian benchmark reference point, Statistics Canada retail trade survey tables are a good starting source.
How to use gross margin month to month:
Treat it like an early warning system, not a performance trophy. If gross margin is down for two consecutive months, don’t wait for the year-end to investigate. Look at pricing and quoting discipline, purchasing and supplier changes, discounting practices, waste and rework, and whether job costs are being captured consistently.
This is the moment where financial KPIs for small businesses start paying off. Owners often feel margin erosion in the day-to-day long before it shows up clearly on the P&L. Gross margin turns that gut feeling into a measurable trend you can act on.
KPI #2: Net Margin (Did we actually keep money after everything?)
Net margin is the “scoreboard” KPI. It tells you what’s left after overhead, interest, and taxes, so it’s the number that answers the real question: did the business model actually produce profit after everything it takes to operate?
Formula: Net Income ÷ Revenue
Where to find it:
Bottom line of your P&L. If you also track EBITDA internally, that can be useful for certain decisions, but net margin keeps the conversation grounded in what the business actually kept.
Directional targets (again, context matters):
BDC references common industry averages often around 5 to 7 percent, with above 7 percent being strong and below 5 percent suggesting room to improve, depending on industry. Their calculator and explanation are here: net profit margin.
What usually drives net margin surprises:
Overhead creep is a frequent culprit. It’s rarely one big item. More often, it’s the slow accumulation of software subscriptions, bank charges, vehicle costs, insurance, and contractor spend that becomes “normal” and stops being questioned. Labour can also quietly expand ahead of sales, especially when teams hire for growth that arrives later than expected.
A practical way to use net margin:
Compare the current month to the same month last year, not just to last month. Seasonality is real in Canada across trades, hospitality, tourism, retail, and professional services. When you compare year-over-year, you get a clearer signal. Then ask: what changed in the business, not just in the report?
If you want financial KPIs for small business that lead to better decisions, net margin is where you confirm whether “busy” is translating into “profitable.”
KPI #3: A/R Days (How fast do we get paid?)
A/R days, often called DSO, is one of the most actionable financial KPIs for small business because it links directly to cash pressure. Even profitable businesses get squeezed when collections slip. When we see cash stress, A/R is often part of the story.
Formula: (Average Accounts Receivable ÷ Credit Sales) × Days in period
Where to find it:
Balance Sheet: Accounts Receivable
A/R Aging Summary: current, 1 to 30, 31 to 60, 61 to 90, and 90+ days
A/R days is one of those KPIs where the number matters, but the list matters more. The aging report tells you exactly which accounts are driving the issue, and it usually shows a pattern: a few recurring late payers, a recurring documentation gap, or a recurring delay in invoicing.
Directional targets:
BDC notes many companies aim for 30 to 45 days, depending on industry and customer mix, in their overview of ratios and performance measures: financial ratios to assess your business.
What usually pushes A/R days up:
Delayed invoicing is the most common. Then come unclear terms, missing purchase orders, unresolved disputes, and inconsistent follow-up. In mid-market teams, another common trigger is growth. Sales ramps up, but billing and collections do not scale with it, so A/R stretches even though revenue looks great.
What to do when it climbs:
Start with speed and consistency. Invoice promptly, make it easy to pay, tighten documentation, and assign clear ownership for follow-up. If you want a process-focused walkthrough that keeps relationships intact, our guide on Accounts Receivable Process: Get Paid Faster in 2026 Without Burning Relationships lays it out step by step.
In practice, financial KPIs for small business work best when you pair the KPI with a routine. For A/R, that routine is usually a short weekly review of overdue invoices, even if the KPI itself is reviewed monthly.
KPI #4: Cash Runway (How many months can we operate if sales dip?)
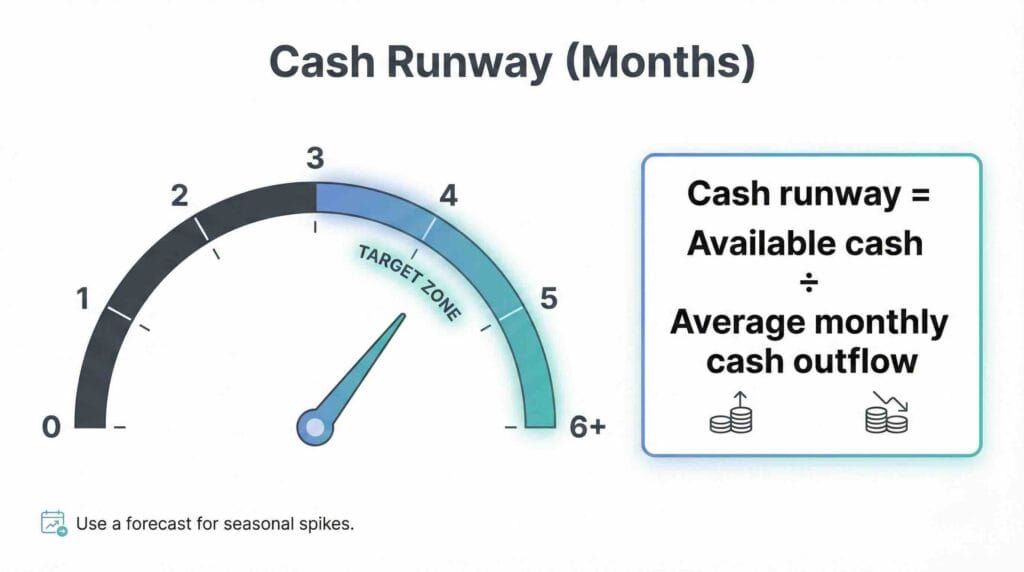
Cash runway turns anxiety into a number you can manage. It answers: if revenue softened tomorrow, how long could we operate based on our available cash and our current spending pattern?
Definition:
Runway is how long you can operate before cash runs out at your current burn. BDC’s definition is clear and practical: cash runway.
Where to find it:
Start with cash in bank, then estimate average monthly cash outflow based on recent months. Runway becomes more accurate when you incorporate a short forecast, especially if you’re seasonal or project-based and cash inflows are lumpy.
A simple approach:
Cash runway (months) = Current available cash ÷ Average monthly cash outflow
How to use it without overcomplicating it:
If runway is shrinking, the goal is not panic, it’s decisions. That might mean tightening discretionary spending, accelerating receivables, adjusting purchasing, reviewing pricing, changing the timing of capital spending, or renegotiating payment terms. The exact lever depends on the business, but the KPI makes the decision-making conversation clearer.
If you want a more structured forecasting rhythm to support this KPI, our post on 12-week cash flow forecasting fits naturally alongside runway tracking.
Cash runway is one of the financial KPIs for small business that tends to change leadership behaviour quickly because it replaces vague “we should be fine” or “we’re nervous” with an actual number and a timeline.
KPI #5: Payroll % (Is labour cost in the right lane?)
Payroll is often the largest controllable cost for Canadian businesses. Payroll percentage helps you see whether labour is scaling appropriately with revenue. It’s also a KPI that exposes operational issues early, like overtime creep, under-scheduled busy days, or staffing that grew ahead of sales.
Formula: Payroll costs ÷ Revenue
What to include (pick a definition and stick to it):
At minimum, include gross wages and employer payroll costs. Many businesses also include benefits in this KPI so they see the true cost of labour, but the key is consistency from month to month.
Where to find it:
Payroll summary or payroll register reports, plus the wage and payroll tax lines on the P&L.
How to use it in context:
Payroll percentage is most useful when you view it alongside gross margin. If payroll percent rises while gross margin falls, you’re getting squeezed from both sides, and it often points to scheduling discipline, quoting accuracy, or how direct labour is being captured and billed.
Operational systems matter here. When time tracking, scheduling, and payroll feeds don’t align, payroll reporting becomes a debate instead of a decision tool. If your team is improving that workflow, our guide on time tracking and payroll integration is a strong companion piece.
When we see businesses get real traction with financial KPIs for small business, payroll percent is frequently part of it because it ties directly to choices managers make every week.
KPI targets by business type (service vs retail)
Benchmarks can help you sanity-check, but they shouldn’t become the goal. The more useful approach is to manage your trend line over the last 6 to 12 months. When something shifts, you investigate why.
Service businesses often show higher gross margins because inventory and materials are lower, but payroll percentage can be higher because people are the core delivery cost. In service models, small shifts in utilization and pricing show up quickly in margin KPIs.
Retail and product-based businesses usually show lower gross margins, and small changes in purchase costs, discounting, or shrink can have an outsized impact on net margin. Payroll percentage is often lower than service, but seasonality and store-level scheduling can cause spikes.
Construction, trades, and project-based businesses live and die by job costing discipline. Gross margin is only as good as the accuracy of direct cost capture and the timing of revenue recognition. A/R days can be heavily influenced by progress billing, documentation, and holdbacks.
Across all of these, the goal is the same: build financial KPIs for small business around consistent definitions and a reliable close process so trends are real, not artifacts.
Monthly KPI review meeting agenda (template that stays practical)
A good KPI meeting feels like operations, not accounting. You’re not reading statements line by line. You’re deciding what to do next.
Keep it short and predictable. Many teams do well with a 30 to 45 minute meeting, scheduled at the same time each month, ideally within 10 business days of month-end so the numbers are still timely.
A simple flow that works:
Confirm the month is closed and the numbers are final.
Review the five KPIs against last month and the same month last year.
Agree on the top two to three drivers behind any meaningful change.
Decide three actions, assign an owner, and set dates.
If you want a small rule that keeps the meeting focused, use a variance threshold. Only discuss a KPI if it moved beyond a set trigger, like 1 to 2 percentage points for margins, or 5 to 10 days for A/R days. That keeps the conversation practical and prevents the meeting from becoming a data tour.
A simple dashboard for financial KPIs for small business
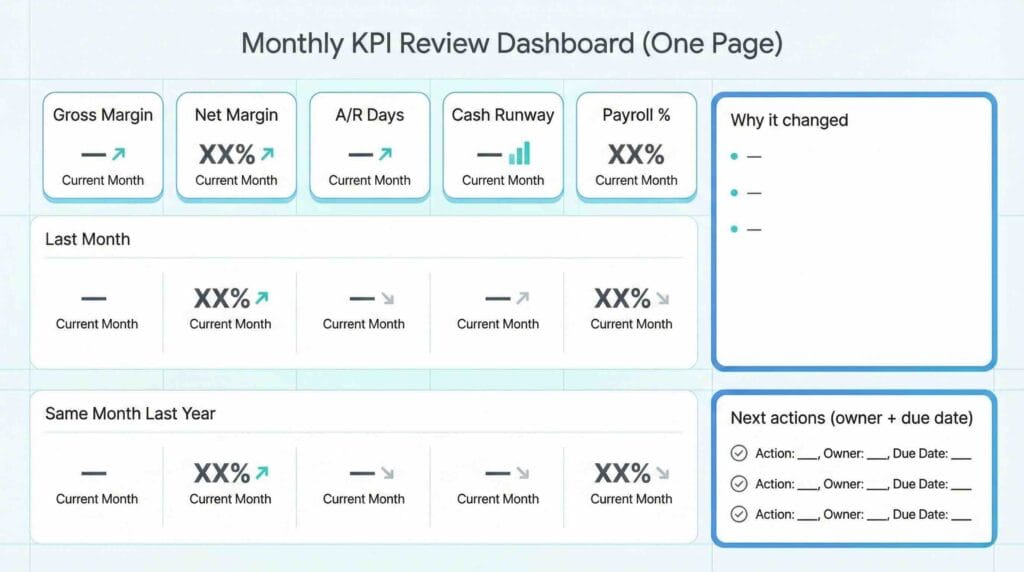
You don’t need fancy BI tools to start. For many Canadian businesses, a one-page monthly dashboard is enough, as long as it’s consistent. The layout matters less than the habit.
A workable format is: five KPIs for the current month, a comparison to last month, a comparison to the same month last year, and a short space for “why it changed” and “what we decided.” When that dashboard looks the same every month, your financial KPIs for small business become a management routine instead of a project that fades when things get busy.
Common mistakes that make KPI tracking feel “off”
When KPI tracking feels frustrating, the issue is usually not the KPI. It’s the process underneath it.
Inconsistent coding is the biggest one. When costs land in different accounts from month to month, you’ll spend your review meeting arguing about classification instead of making decisions. Delayed invoicing is another common offender. A/R days and cash runway get worse, but the root problem is operational and fixable: billing speed, documentation, and follow-up.
We also see confusion when teams mix cash thinking and accrual reporting without realizing it. Your financial statements may be accrual-based, but decisions are being made based on the bank balance. That’s not wrong, but it needs clarity. Decide which view you’re using for which purpose, and keep it consistent.
Finally, many teams try to review KPIs before the month is actually closed. Draft numbers are fine for forecasting, but a monthly KPI review needs final numbers, otherwise you revisit the same month twice and lose momentum.
This is why we often say financial KPIs for small businesses start with a clean, close and consistent definition, then the KPIs become easy.
What to delegate vs keep in-house so the habit sticks
A KPI habit breaks when the owner has to do everything personally. A simple way to protect the habit is to separate preparation from decision-making.
Preparation is usually delegable: month-end close tasks, reconciliations, coding consistency checks, and producing the dashboard. Decision-making should stay with leadership: interpreting drivers, deciding what actions matter, and following through.
If your team is modernizing processes to tighten timelines, our article on bookkeeping automation is relevant here, especially for businesses trying to get KPIs in hand faster after month-end.
When the system is set up properly, financial KPIs for small business stop feeling like extra admin. They become part of how you run the business.
Pulling it together: what a good month looks like
A healthy monthly cycle is simple and repeatable. You close the month promptly and reconcile key accounts. You pull the same five KPIs with consistent definitions. You review changes against last month and last year, then you decide a short list of actions with clear owners.
That’s it. No 40-metric dashboard. No overbuilt reporting package that nobody has time to maintain. Just a consistent loop that keeps you close to the numbers that matter.
If you do only one thing after reading this, make it consistent. Consistent close. Consistent financial KPIs for small businesses. Consistent monthly review. That’s where the value shows up.
Making These KPIs Stick
The most useful KPI system is the one you’ll still be using six months from now. Start with five numbers that cover margin, profit, collections, cash resilience, and labour. Build a monthly cadence that is short, repeatable, and tied to decisions.
When your financial KPIs for small business are consistent, you spot issues earlier, act sooner, and plan with more confidence. Just as importantly, you spend less time debating reports and more time improving operations.
At Valley Business Centre, we’ve supported businesses across Metro Vancouver, Whistler, Squamish, and the Sea to Sky Corridor for more than 30 years with bookkeeping, payroll, tax preparation, and cloud accounting systems.
If you’re a BC business owner or manager in Vancouver, Surrey, Burnaby, Richmond, Coquitlam, or North Vancouver and you want monthly financial KPIs for small businesses that stay accurate and usable, reach out. We can help you tighten up tracking, reconcile deposits and payouts, keep documentation organized, and keep payroll and bookkeeping aligned so year end feels straightforward instead of stressful.
